"I have a model in production, and the data is drifting. How to react?"
That is a model monitoring question we often get.
This data drift might be the only signal. You are predicting something, but don't know the facts yet. Statistical change in model inputs and outputs is the proxy. The data has shifted, and you suspect a decay in the model performance.
In other cases, you can know it for sure. You can calculate the model quality or business metrics. Accuracy, mean error, fraud rates, you name it. The performance got worse, and the data is different, too.
What can you do next?
Here is an introductory overview of the possible steps.
[fs-toc-omit]Want to learn more about ML monitoring?
Sign up for our Open-source ML observability course. Designed for data scientists and ML engineers. Yes, it's free!
Save my seat ⟶
1. Check the data quality

If you are lucky, you have the labels. Should you blindly hit "retrain"?
It might be a good idea to take a pause.
Data drift signals that something changed. What exactly? Let's have a look!
When we talk about data and prediction drift, we usually think about model relevance. Is the model still fit for the task? Is it operating in a familiar environment?
Say we see an influx of users from a new location. They have new behavioral patterns and traits. The data distributions shifted. That is the "real" data drift as we mean it.
It might affect the performance of a model tasked to predict conversions or personalize marketing offers.

But let's say a bug is introduced during the code update. As a result, we stop logging the data for some existing locations. The distributions would shift, too.

That is a data quality problem disguised as data drift.
Data entry errors, schema changes, upstream model issues—we already made a list of things that can go wrong with the data.
Ideally, you should have separate checks for data quality and integrity and react to them on time. You can monitor for missing data, range compliance, and so on.
If you have both types of monitoring set up, data drift and data quality alerts might fire simultaneously. In this case, the data quality check would take priority.
Let's first fix the data.
You can fetch the data from the source again, rewrite the connector, solve the logging issues, update the schema or the feature transformation code, and so on.
There is no need to retrain or update the model in this case. The model is fine, the data is not.
Data quality is almost always the first suspect to consider.
2. Investigate the drift

But what if the drift is "real"?
The model operates in a dynamic environment. Things change. You might have data drift, concept drift, or both at the same time.
The next step is to try and find the real-world culprit to explain it.
As a starting point, you can plot the distributions of the drifted features.

The goal is to understand and interpret the change.
Let's get back to the sudden user influx example. Is it a result of a new marketing campaign? Did we launch an app in a new location? Or is it simply spam traffic?
This might get tricky, of course.
We don't always have access to the "source" of the real-world shift. The features we have are often an incomplete representation of it.
For example, competitors' activities might affect user behavior. But the model features might not contain this information.
Teaming up with domain experts could help come up with possible explanations.
The individual features also don't always tell the whole story. If we deal with concept drift, for example, their distributions might remain similar. But the relationships change instead: in between the features, or between the features and the model output.
You can visually explore it.
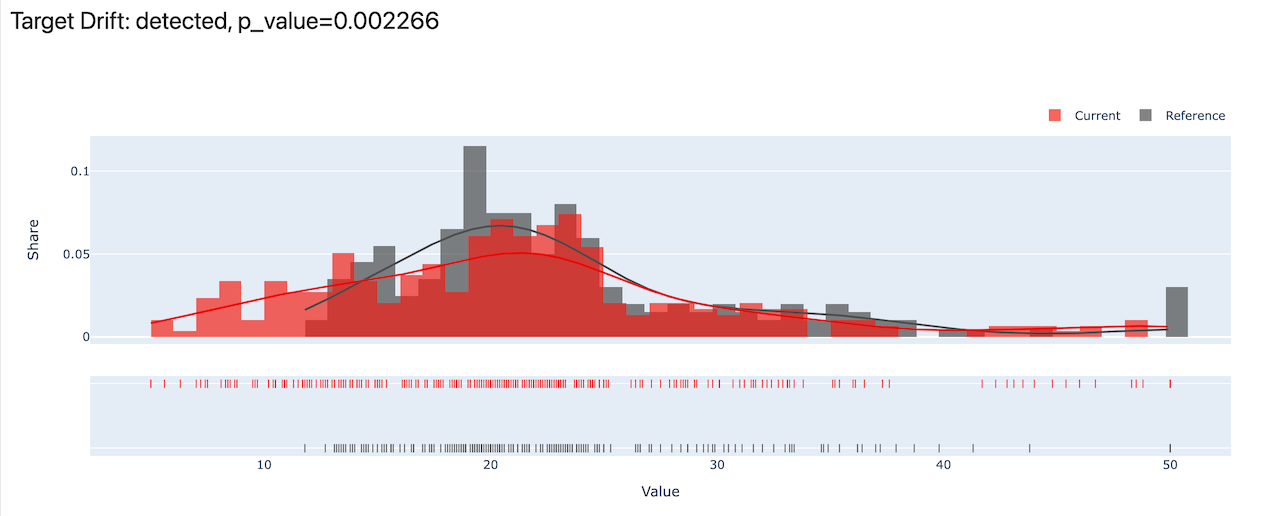
First, you can look at the output distribution shape itself. If you have the actuals, you can see how the facts changed. If you only have the model predictions, you can look at them instead.
You might have a glance at the input and the output distributions and stop there.
Or, you can keep digging.
For example, plot the correlations between the individual features and model predictions. We don't always expect linear relationships, but this simple trick can often surface valuable insights.
Unfortunately, there is no easy and convenient way to plot complex multi-dimensional interactions.

In the example above, you might suspect that a sudden change in correlation between page views and conversion happens due to spam or low-quality traffic.
Is the use case very important? Can you, or someone else, interpret the data well? There are more things to look at.
For example, you can plot the shift in pairwise feature correlations.

A domain expert might even spot the change with a naked eye. For example, a manufacturing engineer could notice a correlation that is not meant to be there in a physical sense. Only a specific equipment failure mode could explain that.
You might have some equivalent of that for your use case.
If you can, understanding this context helps inform the next steps.
3. Do nothing

You got an idea about the drift. Which features are drifting, how many, and how strongly? Maybe, you even grasped the process behind it.
What is next?
You need to decide if the observed drift is, indeed, meaningful. Is it something you should react to?
In an ideal world, we set our drift detection thresholds with that in mind. We choose the key features to look at, pick reasonable statistical tests and tune the confidence levels. We want to be alerted to the things that matter.
In reality, setting drift monitoring is often done by trial and error.
If you get a drift alert in production, that is often a learning exercise. Do you need to react, or is it a false positive?
You might look at the source of drift and decide to live with it.
There are no shortcuts here—you need expert judgment from the data scientist who knows the use case and the data.

Maybe the labels will arrive soon. Let's wait a bit.
You can simply decide to live with a lowered model performance until then. It can be a rational decision for not-so-critical models.
Maybe, the outcome is inconclusive. Let's keep tabs closely.
You can decide to look at the data more attentively during the following model runs. You can schedule some additional reports or add a dashboard to track a specific feature.
Maybe, it was a false alert. Let's adapt the monitoring.
You can discard the notification. If you do not want to be bothered next time the same thing happens, you can change the drift alert conditions or a statistical test used, for example.
In other cases, you might be satisfied with how the model reacts to the drift.
Say you see that a particular class has become more prevalent in model predictions. But it goes nicely with the observed feature drift.
For example, an increase in approved loan applications follows an increase in higher-income applicants. It might look like feature and prediction drift but aligns with the behavior you expect.
It does not always happen this way, of course.
If you decide action is needed, let us review the options.
4. Retrain it, if you can

An easy way out.
This only applies if the new labels are there. But often you have, or can get them!
In some cases, we monitor the data drift out of convenience. We have all we need directly in the machine learning service: features that went in and the model prediction.
The ground truth labels or actual values might arrive with a short delay or reside in a different database than the prediction.
You might need a separate ETL job to get this new data.
If you detect drift, it is time to trigger this semi-manual data preparation process. Export, perform the joins and clean it up for model retraining.
In other cases, you might need to label the data first.
The expert labelers might be in-house. But their time is precious, and you cannot ask them to review the model predictions all the time. You trigger it on demand.
Sometimes, you engage an external team or a service provider. Drift detection signals that it is time to label a new batch of data. Let the model learn the changing patterns!
5. Calibrate or rebuild the model

Here is another option for those lucky to have the labels.
If you face a major change, naive retraining is often not enough. We've discussed this difference in our past blogs.
With retraining, you repeat the existing model training pipeline. You keep the feature engineering steps, model type, hyperparameters, and so on. You only change the training data.
You can add a new bunch of data to the existing dataset or re-run the pipeline on the new dataset only. Or do some combination, mixing old and new. Side note: you can test it in advance to choose what's best for your use case.
Say that is what we did. We "replayed" the model training. But the updated model's performance does not look good on the validation set.
To rebuild or calibrate the model, you can make more changes to the training pipeline.
You can re-run the model experiments from scratch, testing new model architectures, parameters, or feature processing approaches.
You might also test some more specific ideas to combat drift:
- Reweigh samples in the training data, giving more importance to the recent ones. The goal is to make the model give priority to newer patterns.
- Identify new segments where the model fails, and create a different model for it. Consider using an ensemble of several models for different segments of the data.
- Change the prediction target. For example, switch from weekly to daily forecast or replace the regression model with classification into categories from "high" to "low."
- Pick a different model architecture to account for ongoing drift. You can consider incremental or online learning, where the model continuously adapts to new data.
- Apply domain adaptation strategies. There is a number of approaches to help the model better generalize to a new target domain.
As usual with data science, there are no guarantees.
Sometimes the major concept drift breaks the model entirely. Imagine you work on quality prediction on the manufacturing line, and it just got a revamp. That makes the model learnings obsolete.
You might need to wait for more new data to be collected until you can restore the machine learning system.
What other options do you have if machine learning does not work?
You can consider a non-ML solution. Something else robust: based on the understanding of the causal relationships, physics of the process, or expert knowledge.
6. Pause the model and use a fallback

Let's paint a picture.
We know there is model drift. The distributions shifted, the predictions are too far off, or both. But we do not have the labels needed to update the model!
Maybe, they will arrive in 30 days. Or we have the labels, but the data volume is not enough to update the model. If the model errors are risky or costly, we can't just let it go and tolerate unreliable predictions.
Here is the radical option.
Let's not use the model at all!
We can simply switch it off. For example, hide a recommendation block in the application.
In many cases, you can have alternative fallback strategies. Something to resort to if the model does not respond, for example.

A human expert decision is one. Chances are, an ML model is designed to help someone make repeatable decisions.
But if the model is not helping, you can still rely on expert judgment. Imagine insurance claims processing, manufacturing quality control, or lead scoring.
You can ask the user to take action on their own: just like Twitter did when they figured out their image cropping algorithm might be biased. They gave the control back to the user.
Heuristics and rules are another. You can often design a set of rules that will be less precise but more robust than a rogue model.
For example, you can simply show the most popular items to all customers instead of random and poorly matched recommendations.
In some domains, you can switch to another model type. You can use classic scoring models in finance. You can use statistical models for hospital patient triage. You can use first-principle physical models in manufacturing process control.
If you are dealing with a high-risk domain, it is best to design such fallbacks from the get-go.
7. Find the low-performing segments

You might only hit "pause" for some of the model predictions.
Quite often, the change is not universal. It might affect only a segment of the population. Or, a new emerging segment can itself be the change.
If you can define the segments of low performance, that gives you new options. You won't stop the model application entirely. But, you can limit it for some of the data inputs instead.
This can work even if you do not have the ground truth labels.
Here is an example.
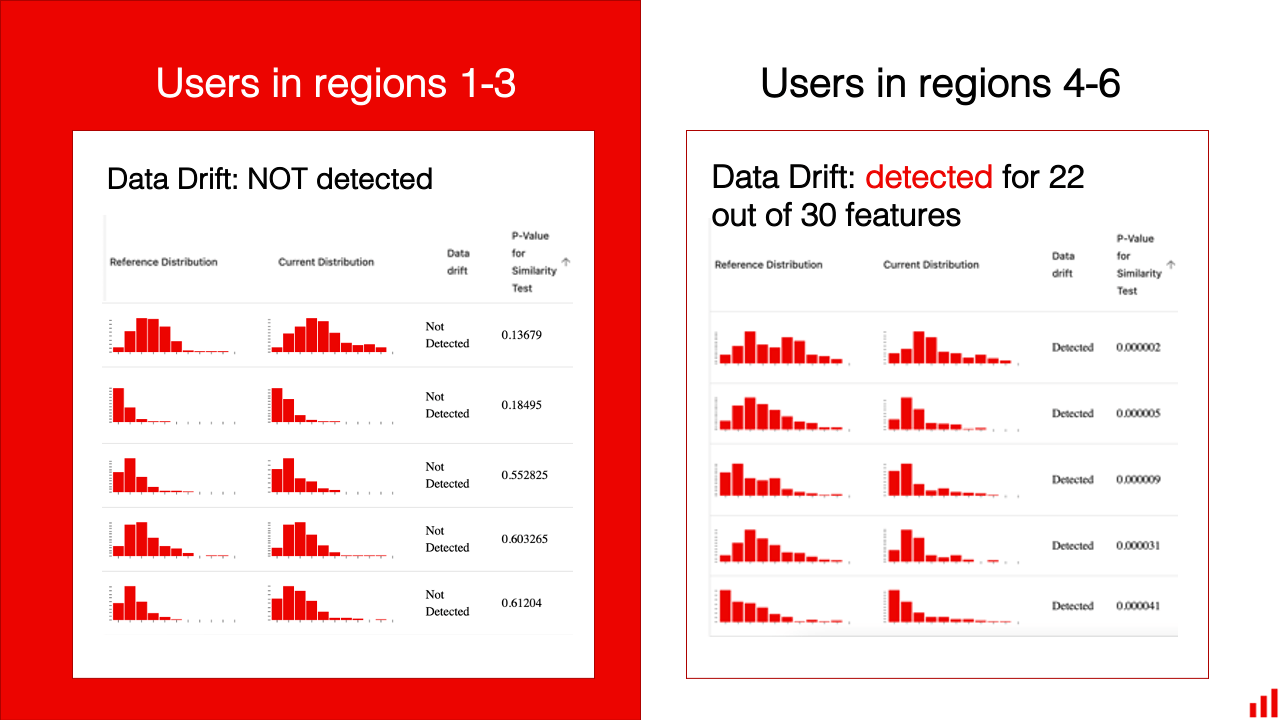
Let's say we got a data drift alert for a marketing personalization model. We start the investigation. We see a shift in the model predictions and some of the features.
Our favorite "location" category has a different distribution again. That equips us with a hypothesis to test: could all the change be attributed to the new regions?
Some of the location categories are new. Some were rare in training but became more frequent.
We filter our data to look further.

Maybe that means dropping about 40% of the data. Let's now look at what is left!
It turns out, the rest of the distributions are stable and similar to training. Filtering by location helps us isolate everything novel!
We can then decide to route our predictions.
For frequent, known user locations, we can rely on the model. For the rest, we can devise some heuristics. In a personalization example, the marketing team might come up with manually curated recommendations, or we can resort to the "top most popular" list.
In a manufacturing process control example, we might find that the drift is associated with a new raw material supplier.
We can single out the production batches when it is being used. For these more complex cases, we can rely on an operator decision. Once enough new labeled data is collected, we will update the model.
Of course, if you have access to new labels and can evaluate the actual model quality, finding and defining the segments of low performance can be even more reliable.
For example, you can directly rank meaningful segments by performance or explore the areas with the highest model error. Here is how we made this analysis for an employee attrition model.
What if this does not work? You can try something else on top.
8. Apply business logic on top of the model

In this option, you would make an adjustment on top of the model prediction or change the application logic.
There are different ways one can do that. The downside of this approach is that it is quite hard to generalize. With the best intentions, we might end up making things only worse.
It is up to the modeler and domain expert to make a call.
Here are a few examples.
Manual correction of the output. That is something quite common in demand forecasting.
Even in an "ordinary" course of model application, you often have a set of complex business rules for specific items, categories, and regions. You might be used to adjusting the model forecast to account for the promotional activities, marketing campaigns, and known events.
DoorDash, for example, relies on combining expert judgment with machine learning in demand forecasting.
In light of data or concept drift, you might apply a new correction on top of the model output. For example, you can change the model output by X% for a given category or set minimum or maximum values to ensure the business process does not suffer.
Use with caution!
Setting a new decision threshold is possible for classification problems.

Often the model output is a probability. It says that one customer is likely to churn at 80% and another at 60%.
You can control the decision threshold here. For example, you can decide to assign the label "churn" only if the predicted probability is above 50%, or 80%, or even 95%. We explored the implications in the tutorial on employee attrition.
If your data is drifting, you might decide to change this. For example, set the threshold higher than it was before.
You can do that under the assumption that the model is well-calibrated, and higher predicted probability is something to rely on. Or that you limit the possible damage of spending the retention budget in vain by restricting the number of clients to contact.
Processing outliers in a separate workflow is another way to try to limit errors.
We've recently discussed the difference between drift and outlier detection. Outliers focus on detecting individual "different" data points.
If you operate in a changing environment, you might decide to keep the model running even in the presence of drift. Instead, add a separate workflow to try to "catch" the most strange inputs the model probably won't be able to handle.
For example, you'd set a detector to spot the most different or novel inputs. Then, you can send them for manual processing. Or, you make a design decision not to show the model prediction in this case at all.
Such manual tweaking is rarely precise. Be careful to weigh the risks and downsides against the available baseline.
Before we sum these options up, let us take a small detour.
Data drift: a prequel

We started this blog with the question: what to do when you notice drift?
In an ideal world, you better reverse the approach. Consider the possible actions first, then design the drift detection framework.
There is no single, universal "drift" event that happens to a machine learning system and prompts you to react. The model creator defines the degree of change to be alerted on and how to act on it.
First, evaluate the model context. What is the real-world process behind the data? How exactly do you expect it to change?
Next, decide how important the model is. Do you care about small fluctuations or only major shifts? And what is a "major" shift: how much will a model failure cost you?
Then, consider the options. When do you get the new labels to update the model? Are there any alternative models or systems you can rely on to make the decision? Do any of the ideas above fit in the maintenance workflows?
After that, think backward to design the drift detection workflow, metrics, and thresholds.

For example, you might not need to look at distribution drift at all. If you get true labels fast enough, you can directly calculate the model quality. If you care primarily about broken inputs, you can do rule-based data validation checks.
On the other hand, if you have delayed ground truth, a critical use case, and features you can interpret well, you might have a detailed data drift detection dashboard and a whole set of statistical tests to run.
There are a lot of variations here.
You might design a custom drift function made up of individual features weighted by importance. Or, simply look at the top-5 features you care about most.
You can choose a statistical test that better fits a particular feature distribution. Or monitor the correlations between certain features because it is something that has meaning to domain experts.
You might not mind false-positive alerts on drift because the model is critical. Or, you only want to be informed if it is entirely broken.
And everything in between.
Summing up
The design of the drift monitoring system is critical. Make sure the way you set up the alerts aligns with the possible actions.

If drift is detected, here is what you can do:
- Check the data quality. Make sure the drift is real.
- Investigate. Explore the data changes to understand what might be causing them.
- Do nothing. You might treat this as a false alarm, be satisfied with how the model handles drift, or simply decide to wait.
- Retrain it, if you can. Get new labels and actual values and re-fit the same model on the latest data. Drop the old as needed.
- Rebuild it, if you need. If the change is significant, you might need to rebuild the training pipeline and test new model architectures.
- Use a fallback strategy. Make a decision without machine learning.
- Limit the model use. Find and exclude the segments of low performance.
- Add custom processing logic. Add corrective coefficients, change decision thresholds, review outliers. Use with great caution.
Have a question about production machine learning? Join our Discord community and ask in the #ds-ml-questions channel.
[fs-toc-omit]Get started with open-source ML monitoring
Evaluate, test, and monitor ML models in production with Evidently. From tabular data to NLP and LLM. Built for data scientists and ML engineers.
Get started ⟶
Cloud waitlist ⟶


