

Ranking and Recommendation Metrics Guide
10 metrics to evaluate recommender and ranking systems
There are different ways to evaluate recommendations, from predictive and ranking metrics to tracking behavioral properties like diversity or novelty.
This guide provides an overview of the main evaluation principles for ranking and recommendations, introduces metrics you can use, and gives a deep dive into 10 of them.
We also introduce Evidently, an open-source Python library for ML model evaluation and monitoring.
TL;DR
- Recommendations and ranking systems share the goal of returning a list of items sorted by relevance.
- To evaluate recommendations, you must have predictions as user-item pairs, the binary or graded relevance score as the ground truth, and choose the K parameter.
- The K parameter sets the cutoff point for the top recommendations you evaluate.
- You can use predictive metrics like accuracy or Precision at K or ranking metrics like NDCG, MRR, or MAP at K.
- To go beyond accuracy, you can use behavioral metrics like serendipity, novelty, or diversity of recommendations.
- To measure the actual impact, you can track business metrics like sales, click-through rates, or conversions during online evaluations.

Want to keep tabs on your ranking and recommendation models? Automate the quality checks with Evidently Cloud. Powered by the leading open-source Evidently library with 20m+ downloads.
Want to keep tabs on your ranking and recommendation models? Automate the quality checks with Evidently Cloud. Powered by the leading open-source Evidently library with 20m+ downloads.
What is a recommender system?
TL;DR. A recommender system solves a ranking task. It returns a list of sorted items that might be relevant for a specific user. Other ranking examples include search and information retrieval, where the goal is to rank documents relevant to a particular query.
Picture this: you're scrolling through Netflix, browsing Amazon, or diving into articles on Medium, and suddenly, bam! There's that product, movie, or article you didn't know you needed but turned out exactly what you were looking for. Thank you, recommender system!
A recommender system is a specialized information filtering system, trained to predict user preferences or ratings for a given item, such as movies you are likely to watch or products you are likely to buy. You can employ recommendations for many use cases, from e-commerce stores to your favorite social networks.
Under the hood, a recommender system prepares a list of potential matches for each user and then sorts them from best to worst. In a more technical sense, the goal of a recommender system is to establish a mapping function to predict the utility for various user-item pairs and then sort the items based on their calculated utility (= a measure of how well it matches the user profile or intent).

The recommender system is one flavor of a ranking task, but there are others. Ultimately, the goal of any ranking system is to help prioritize and arrange items in a list. However, the expectations on how to do it best may vary.
A different example of a ranking task is an information retrieval system like an internet search engine. Unlike recommendations where you want to find items that broadly match a “user’s profile,” search happens after an explicit user’s input or query.
Think about the last time you typed something in a search engine. Chances are, you did not look for it to surprise or entertain you with unexpected links. Instead, you wanted to find the correct response to your query at the very top of the page.
You also handle ranking tasks in LLM evaluations when assessing the quality of a RAG system (Retrieval-Augmented Generation). In this scenario, your AI system first searches for the most relevant context to support the answer — this is essentially a ranking task.
Despite their differences, the output of any ranking system usually looks the same: it is a list of items (movies, products, items, documents, texts, links) ordered by their expected relevance. Since all ranking systems aim to present items in a sorted manner, you can often use the same metrics to evaluate them. Of course, there are a few nuances regarding when each metric fits best for each task.
This guide will cover a few common metrics for ranking and recommendation, from Precision and Recall to more complex NDCG, MAP, or Serendipity.
Evaluation principles
Before we dive into the metrics, let’s establish the shared principles in evaluating recommender and ranking systems.
[fs-toc-omit]Input data
TL;DR. You need the model predictions and ground truth to evaluate the recommendation or ranking quality. Predictions are a list of ranked items generated by the model. The ground truth is the actual relevance label or score.
Let's start with the data. A recommendation dataset typically looks like this: you have a list of users and items. For each user-item pair, you have a score or a rank. This is the model prediction. (If you deal with search, swap the user for a query).

Items are whatever your system is ranking. For an e-commerce store, these are product IDs; for Netflix, these are movies to watch; for a search system, these are pages to rank, and so on.
But how do you know if the ranking is any good? To evaluate the quality of the predictions, you must compare these ranks or scores against some ground truth. These target values reflect the actual success of recommendations. We often refer to them as relevance scores.

Once you have the ground truth, you can judge how closely the predictions align with user preferences or outcomes.
Now, how exactly do you get these relevance scores?
Before putting recommender systems to use, you usually perform offline evaluation. The goal is to test your best model or compare a few candidates. In these scenarios, you work with historical data. The ground truth is already there.
Here is how the process usually goes:
- You start with the dataset that records the users' activities, such as movies they watched or items they bought.
- You split all available data into training and test sets chronologically.
- You use the earlier data to train a model and predict, say, future purchases by a specific user.
After you generate the recommendations, you can compare the predictions against the unseen data in the test set.

Say you trained the movie recommendation model on the part of the viewing history and generated a set of predictions for each user. Then, you can compare the recommendations (movies the system expected the users to like) against the remaining watch history (what the users watched outside of the training data).
In this case, the record of the movies users watched later provides the “ground truth” for the model evaluation.
When you monitor live recommendation systems in production, you can collect the ground truth as it comes by recording meaningful user actions. The good news is that you can often get the data quickly.
For example, if you display recommendations on an e-commerce website, you can track user clicks, upvotes, or purchases. Say, if you show a “you might also like” block at the user, you might track if the user adds any recommended items to the cart.

Building a proper event-tracking process within the application to capture necessary user actions is crucial to production recommender system monitoring. Without this data, you cannot know if you are getting it right. These online user actions are the source of ground truth that reflects the actual relevance of recommendations.
But wait – what is this relevance, once again?
[fs-toc-omit]What is the relevance?
TL;DR. Relevance reflects the quality of the individual item in the list. It can be a binary score (for example, based on the user action – like clicking, watching, or buying a recommended item) or a graded score (like a rating from 1 to 5).
Relevant recommendations are the “good” or “accurate” recommendations — however you define this ”goodness.” Relevance reflects how well an item matches a user profile or query. Say, for e-commerce stores, relevant items are things you are likely to buy. For a search engine, these are the documents that answer a given query well.
But how exactly do you measure and express this relevance?
Relevance is often a simple binary score: for each item, you can decide whether it is relevant. Did the user click on it? Relevant. Skipped? Not. Did the user give it a like? Add it to the cart? Started listening to the podcast? You got the idea. All you need to do is to record the chosen action and match it with a recommended item.

You might also have a graded relevance score. For instance, you can assign specific values to different user actions. In a simplified example: “1” if the user clicks on an item, “2” if they save it as a favorite, “3” if they add it to the cart, “4” if they complete the purchase. Such a scoring system requires custom design – and is not always easy to maintain in practice.
The grading may happen naturally, such as when users give 1-5 star ratings to the items they buy or movies they watch. You can use these numerical scores as the measure of relevance.
In certain applications, like Internet search, you might even involve human assessors to provide structured grading. They can review some portions of the documents for specific queries and manually assign scores to label the degree of relevance.

Regardless of how you get the relevance scores, you might still need to post-process them. Many ranking quality metrics – with a few exceptions like NDCG – expect binary relevance as an input.
To convert scores into labels, you might use a simple rule, such as considering any four and 5-star reviews to reflect the relevance and treat anything below three as a “dislike.” If you expect bias in labels, such as some users giving consistently higher or lower ratings, you might weigh or normalize them to ensure your static threshold is not too rigid.
[fs-toc-omit]Top-K parameter
TL;DR. The K parameter is the evaluation cutoff point. It represents the number of top-ranked items to evaluate. For example, you can focus on the quality of top-10 recommendations.
When it comes to ranking quality evaluation, you typically need to define the K parameter. The "K" represents the number of top recommendations (ranked items) you want to assess.
The idea is pretty simple. The system may provide tens, hundreds, or even thousands of rankings or recommendations. These are too many items to sort through! Imagine the number of goods on Amazon on pages on the internet.
At the same time, the user's attention and time is limited. They will likely only look at and have the chance to interact with the limited set of top items. And this is where you want to focus on with your evaluations!

K sets this cut-off point. Are you looking at top-10 recommendations? Or top-3? Or top-100? You can pick the number based on the use case. Or pick several Ks simultaneously.
The choice is up to you. Sometimes, the limit is based on how you present the recommendations. For example, you have exactly five spots in the block to suggest complementary items at the e-commerce checkout. Setting the K to 5 would make sense: you want to know how good these recommendations are, not what happens at the rank 100.
Do you always need a K? If you have a few items and know all the actual ranks, you might not need a cut-off. However, most recommendations and ranking scenarios involve lots of items. The users can't feasibly interact with all of them. You can't obtain enough actual labels. And if you can label every item, the data tends to be extremely skewed: 99.9% of items are irrelevant for a given user. So, there is little point in going too deep down the list, let alone looking at every item. You need to focus your evaluations on the top K.
[fs-toc-omit]Types of metrics
TL;DR. Predictive metrics evaluate how accurate the model predictions are. Ranking metrics show how well the items in the list are ordered. Behavioral metrics reflect important system properties like diversity of recommendations.
Let’s sum it up! To evaluate a recommendation or ranking system, you need:
- The model predictions. They include the ranked list of user-item pairs. The complete dataset also contains features that describe users or items. You’ll need them for some of the metrics.
- The ground truth. You need to know the actual user-item relevance to evaluate the quality of predictions. This might be a binary or graded relevance score. It is often based on the user interactions, such as clicks and conversions.
- The K. You need to pick the number of the top recommendations to consider. This puts a constraint on evaluations: you will disregard anything that happens after this cutoff point.
Say you have all this in your dataset. How do you assess whether the recommendations are good enough to track and compare the performance? There are a few ways to figure this out.

We can roughly group the recommender or ranking quality metric into three categories:
1. Predictive metrics. They reflect the “correctness” of recommendations and show how well the system finds relevant items.
2. Ranking metrics. They reflect the ranking quality: how well the system can sort the items from more relevant to less relevant.
3. Behavioral metrics. These metrics reflect specific properties of the system, such as how diverse or novel the recommendations are.
No single metric can capture all aspects of system performance at once. You can combine several offline metrics for a comprehensive evaluation. Additionally, you can incorporate online business metrics, user feedback, and subjective evaluations for a more holistic assessment.
Let’s explore some of the metrics in detail!
Predictive quality metrics
Predictive metrics assess if a system can make accurate predictions about item relevance.
If you deal with a graded relevance score, you can employ regression metrics, such as Mean Absolute Error (MAE), Mean Squared Error (MSE), or Root Mean Squared Error (RMSE). They help measure the error between predicted and actual scores.
If your system has a binary relevance label, you can borrow metrics from classification tasks, such as Precision at K, Recall at K, or F-measure.
Let’s look at some metrics suitable for binary relevance labels.
Precision at K
TL;DR. Precision at K measures the proportion of relevant items among the top K items.
Precision shows how many recommendations among the provided ones are relevant. It gives an assessment of prediction “correctness.” It is intuitive and easy to understand: Precision in ranking works the same as its counterpart in classification quality evaluation.
But there is a rub: Precision values vary depending on the number of relevant items a user has. If there are a total of 3 relevant items – the maximum Precision at ten is capped at 30%. This makes it hard to compare or average Precision across all users in the dataset.
Ultimately, Precision is useful when there are many relevant items for each user, but their attention is limited. For example, you expect hundreds of potential matches, and your goal is to pick the top 5 to show. Precision helps measure how good this shortlist is.

Recall at K
TL;DR. Recall at K measures the coverage of relevant items in the top K.
Recall at K shows how many relevant items, out of their total number, you can successfully retrieve within the top K recommendations.
Say there are a total of 8 relevant items in the dataset. If you show five of them in the top-K recommendations, the Recall is 5/8 = 62.5%.

Recall helps measure coverage: how many relevant items the system captured in the top K. It works well for applications with only a few relevant items, for example, in topic-specific information retrieval. You might expect the system to be able to return all relevant items in the search results, even at the cost of Precision.
Want a deep-dive explanation of Precision and Recall at K? Check out this guide.
F-score
TL;DR. The F Beta score is a metric that balances Precision and Recall.
The F Beta score at K combines Precision and Recall metrics into a single value to provide a balanced assessment. The Beta parameter allows adjusting the importance of Recall relative to Precision.

If you set the Beta to 1, you will get the standard F1 score, a harmonic mean of Precision and Recall.
The F Beta score is a good metric when you care about both properties: correctness of predictions and ability to cover as many relevant items as possible with the top-K. The Beta parameter allows you to customize the priorities.
Can you limit the ranking evaluation to predictive metrics? Metrics like Precision and Recall are very interpretable and easy to explain to non-technical users. They successfully capture the correctness of predictions. Both make them very useful. However, they have limitations.
Precision and Recall depend heavily on the total number of relevant items. Because of this, it might be challenging to compare the performance across different lists.
In addition, metrics like Precision and Recall are not rank-aware. They are indifferent to the position of relevant items inside the top K.
Consider two lists that both have 5 out of 10 matches. In the first list, the relevant items are at the very top. In the second, they are at the very bottom. The Precision will be the same (50%) as long as the total number of relevant items is.

It’s not always what you expect: you might want to give more credit to the model when it can place more relevant items higher up. Ranking metrics help reflect this!
Ranking quality metrics
Ranking metrics help assess the ability to order the items based on their relevance to the user or query. In an ideal scenario, all the relevant items should appear ahead of the less relevant ones. Ranking metrics help measure how far you are from this.
Let’s take a look at some of them.
MRR
TL;DR. MRR calculates the average of the reciprocal ranks of the first relevant item.
MRR (Mean Reciprocal Rank) shows how soon you can find the first relevant item.
To calculate MRR, you take the reciprocal of the rank of the first relevant item and average this value across all queries or users.
For example, if the first relevant item appears in the second position, this list's RR (Reciprocal Rank) is 1/2. If the first relevant item takes the third place, then the RR equals 1/3, and so on.

Once you compute the RRs for all lists, you can average it to get the resulting MRR for all users or queries.
MRR is an easy-to-understand and intuitive metric. It is beneficial when the top-ranked item matters: for example, you expect the search engine to return a relevant first result.
However, the limitation is that MRR solely focuses on the first relevant item and disregards all the rest. In case you care about overall ranking, you might need additional metrics.
Want a deep-dive explanation? Check out this guide to MRR.
MAP
TL;DR. MAP measures the average Precision across different Recall levels for a ranked list.
Mean Average Precision (MAP) at K evaluates the average Precision at all relevant ranks within the list of top K recommendations. This helps get a comprehensive measure of recommendation system performance, accounting for the quality of the ranking.
To compute MAP, you first need to calculate the Average Precision (AP) for each list: an average of Precision values at all positions in K with relevant recommendations.

Once you compute the AP for every list, you can average it across all users. Here is the complete formula:
MAP helps address the limitations of “classic” Prediction and Recall: it evaluates both the correctness of recommendations and how well the system can sort the relevant items inside the list.
Due to the underlying formula, MAP heavily rewards correct recommendations at the top of the list. Otherwise, you will factor the errors at the top in every consecutive Precision computation.
MAP is a valuable metric when it is important to get the top predictions right, like in information retrieval. As a downside, this metric might be hard to communicate and does not have an immediate intuitive explanation.
Want a step by step explanation? Check out this guide to MAP.
Hit rate
TL;DR. Hit Rate measures the share of users that get at least one relevant recommendation.
Hit Rate at K calculates the share of users for which at least one relevant item is present in the K. This metric is very intuitive.
You can get a binary score for each user: “1” if there is at least a single relevant item in top K or “0” otherwise. Then, you can compute the average hit rate across all users.

Note that the Hit Rate typically increases with K: there is a higher chance to encounter a relevant item in a longer list.
You can also compute multiple Hit Rate measurements at different K, for example, Hit Rate at 3, Hit Rate at 5, and Hit Rate at 10, and track them individually.
NDCG
TL;DR. NDCG considers both the relevance and the position of items in the ranked list.
Normalized Discounted Cumulative Gain (NDCG) measures the quality of a ranking system, considering the position of relevant items in the ranked list while giving more weight to the items placed higher.
NDCG relies on the idea of cumulative gain, which measures the total item relevance in a list. To give more credit to the items higher in the ranking, it uses DCG (Discounted Cumulative Gain). DCG introduces a logarithmic discount to give lower weight to items further in the list.

Then, you can divide the Discounted Cumulative Gain by the gain of an ideally ranked list where all the items are perfectly sorted based on relevance. As a result, you get a normalized (0 to 1) metric that shows how your ranking compares to an ideal outcome for a given list.
Importantly, NDCG can also handle graded relevance scores when computing the cumulative gain.
Want a step by step explanation? Check out this guide to NDCG.
Are ranking quality metrics enough? They help assess the ability to sort the recommended items in the right order, which is what you might expect from a well-performing system.
It is also helpful that many ranking metrics are inherently normalized. You can perform a fair comparison across lists of different lengths, irrespective of the total number of relevant items in the dataset.
However, in practice, you might also care about additional qualities of the recommendation system. For example, is it showing different items to different users, or does it suffer from popularity bias? How novel are recommendations shown to each user? Behavioral metrics that help measure this.
Behavioral metrics
Behavioral metrics help go “beyond accuracy” and evaluate important qualities of a recommender system, like the diversity and novelty of recommendations.
Let’s take a look at some of these metrics.
Diversity
TL;DR. Diversity evaluates the variety of items recommended to users.
Recommendation diversity assesses how varied the recommended items are for each user. It reflects the breadth of item types or categories to which each user is exposed.
To compute this metric, you can measure the intra-list diversity by evaluating the average Cosine Distance between pairs of items inside the list. Then, you can average it across all users.
Diversity is helpful if you expect users to have a better experience when they receive recommendations that span a diverse range of topics, genres, or characteristics.
However, while diversity helps check if a system can show a varied mix of items, it does not consider relevance. You can use this metric with ranking or predictive metrics to get a complete picture.

Novelty
TL;DR. Novelty assesses how unique or unusual the recommended items are.
Novelty assesses how unique the recommended items are to users. It measures the degree to which the suggested items differ from popular ones.
You can compute novelty as the negative logarithm (base 2) of the probability of encountering a given item in a training set. High novelty corresponds to long-tail items that few users interacted with, and low novelty corresponds to popular items. Then, you can average the novelty inside the list and across users.
Novelty reflects the system's ability to recommend items that are not well-known in the dataset. It is helpful for scenarios when you expect users to get new and unusual recommendations to stay engaged.

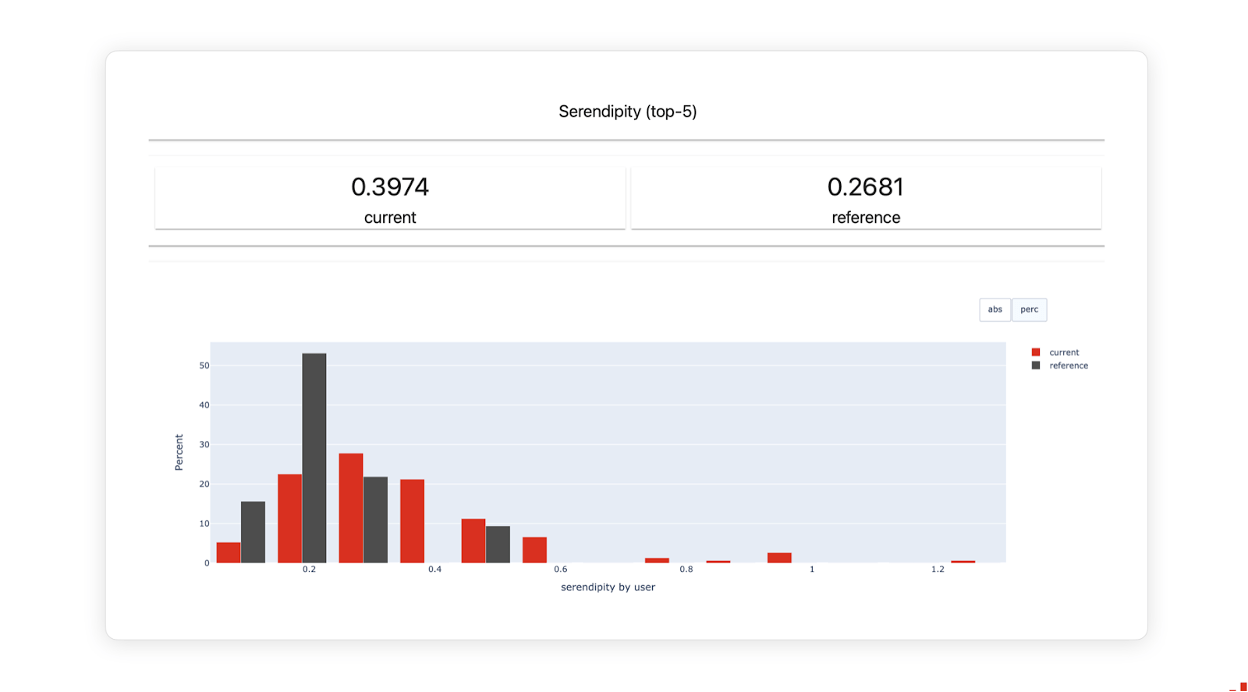
Serendipity
TL;DR. Serendipity measures the unexpectedness or pleasant surprise in recommendations.
Serendipity evaluates the system's ability to suggest items beyond the user's typical preferences or expectations.
Serendipity is challenging to quantify precisely, but one way to approach it is by considering the dissimilarity (measured via Cosine Distance) between successfully recommended items and a user's historical preferences. Then, you can average it across users.
Serendipity reflects the ability of the system to venture beyond the predictable and offer new recommendations that users enjoy. It promotes exploring diverse and unexpected content, adding an element of delight and discovery.

Popularity bias
TL;DR. Popularity bias helps assess if there is a bias towards recommending popular items.
Popularity bias refers to a phenomenon where the recommendation favors popular items over more diverse or niche ones. It can lead to a lack of personalization, causing users to see the same widely popular items repeatedly. This bias may result in a less diverse and engaging user experience.
There are different ways to evaluate the popularity of recommendations, for example:
- Coverage: the share of all items in the catalog present in recommendations.
- Average recommendation popularity (ARP).
- Average overlap between the items in the lists.
- Gini index.

Business metrics
Finally, you can measure business or product metrics when evaluating the online quality of the recommendation systems. They help understand the true impact of recommendations – whether they lead to the desired business outcomes. Here are some examples of metrics:
Revenue. First things first, if you can – you can measure and prioritize metrics like average revenue per user (ARPU). You can estimate them in an A/B test, comparing the recommendations sales uplift against your baseline or a different model. You can also continuously monitor them in production: a sudden drop in the top business metrics will be the best signal of potential performance issues.
Click-through rate (CTR). CTR is a straightforward metric that measures how often users click on recommendations. This metric is common in applications like online advertising. Unlike revenue, it does not suffer as much from attribution issues. You can simply measure the ratio between clicks and impressions (the number of times a certain item is shown). CTR helps track how many of the recommendations attract attention and engagement.
Conversion rate. In addition to clicks, you can measure the actual conversions. You can track the share of clicks that result in a desired action – such as purchase (in e-commerce), listening to a song (in media recommendations), or adding a recommended person as a friend (in social networks), and so on.
User engagement metrics. You can also collect data about relevant user behavior, such as session length (e.g., time spent on the page, in-app, etc.), bounce rate (the share of users who leave after only viewing one page or item), and other metrics that reflect the experience and degree of interaction with the recommended content.
Ultimately, all such business metrics are not specific to machine learning. They are based on the product and business needs that led to the development of the recommendation system in the first place.
Ranking quality with Evidently
Evidently is an open-source Python library that helps evaluate, test and monitor machine learning models, including ranking and recommendations. Evidently computes and visualizes 15+ different ranking metrics, from MAP to behavioral metrics like serendipity and diversity.
By passing your dataset, you can quickly generate a comprehensive report with multiple metrics and interactive visualizations out of the box.
You can also use Evidently to run CI/CD tests, for example, to evaluate the model quality after retraining and deploy a live monitoring dashboard to keep track of the model metrics and test results over time.
Would you like to learn more? Check out the open-source Getting Started tutorials.
[fs-toc-omit]Get started with AI observability
Try our open-source library with over 25 million downloads, or sign up to Evidently Cloud to run no-code checks and bring all the team to a single workspace to collaborate on AI quality.
Sign up free ⟶
Or try open source ⟶

Evidently AI Team

.svg)

Read next


Get started with Evidently

